
Dashboard & Analytics
DASHBOARD & ANALYTICS
See how service is performing across the property.
Apgile brings request status, staff activity, and service performance into one configurable dashboard. Managers can focus the view by location, area, service item, staff member, and time period to understand what is happening and where additional attention may be needed.
DASHBOARD & ANALYTICS
See how service is performing across the property.
Apgile brings request status, staff activity, and service performance into one configurable dashboard. Managers can focus the view by location, area, service item, staff member, and time period to understand what is happening and where additional attention may be needed.
Designed to make service activity easier to understand
Bring request status, staff activity, and service performance into one operational view. Focus the dashboard on the locations, services, staff members, and periods that matter. Review current activity and historical patterns without reconstructing the service story manually.
Summary at a glance
Review total, completed, declined, expired, system-closed, and internal activity from one summary area.
Request-status visibility
See how much service activity has been completed and which requests ended in another status.
Staff-performance view
Compare staff activity during the selected period and identify how work is distributed across the team.
Historical service trends
Review request activity and average response and completion time across the selected dates.
One dashboard for the operational picture
The dashboard begins with a high-level view of request status and enabled operational categories. Filters and charts below the summary area allow managers to move from the overall picture to the specific location, service, staff member, or time period they need to review.
Request-status summary
See total activity and the number of completed, declined, expired, system-closed, and internal requests.
Operational availability
Review enabled operational indicators such as online staff and active service areas.
Flexible filtering
Narrow the analysis by location, area, service item, staff member, and selected period.
Performance views
Move between request counts, staff performance, activity trends, and service-performance charts.
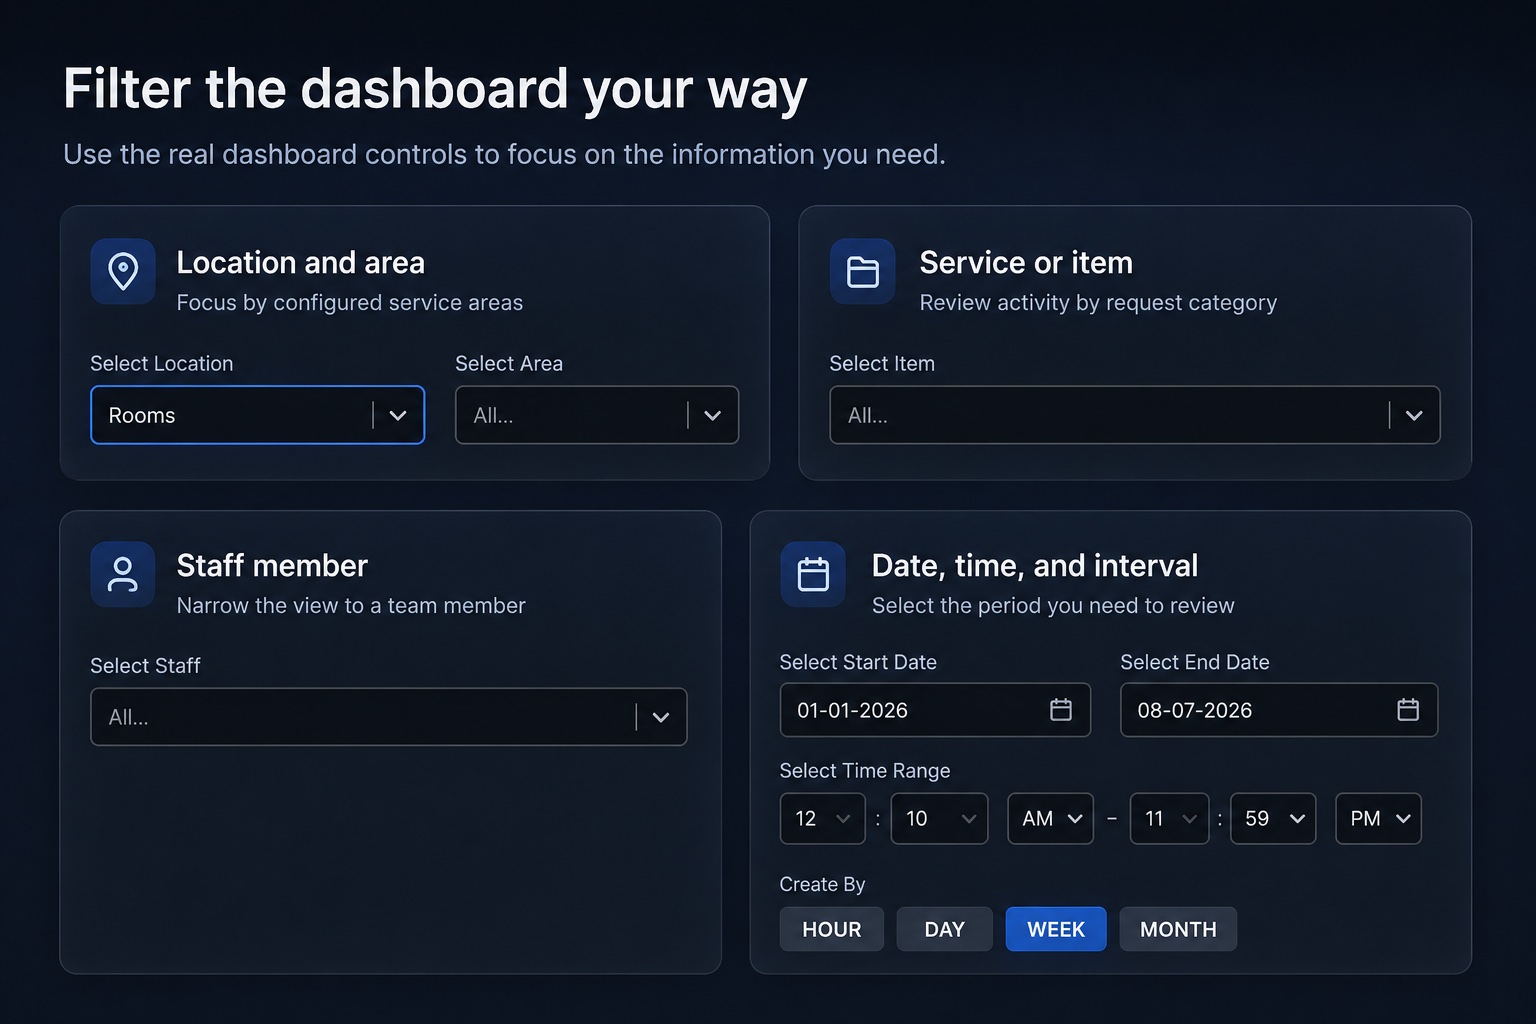
Focus the dashboard on the question you need to answer
Managers do not need to review the entire operation every time. The dashboard can be narrowed to the location, service, staff member, and time period relevant to the question being investigated. Available filters reflect the locations, services, staff, and request sources configured for the deployment.
Location and area
Focus the view on a selected property location, room group, venue, operational area, or other configured service point.
Service or item
Review activity associated with a selected service, request category, or enabled item.
Staff member
Narrow the results to activity associated with a selected staff member or team member.
Date, time, and reporting interval
Select a start date, end date, time range, and reporting interval such as hour, day, week, or month.
Review performance from several angles
Each chart provides a different view of the same service activity, helping managers move from overall request volume to staff activity and response or completion trends.
Request counts by status
Compare total activity with completed, declined, expired, system-closed, and internal request counts.
Staff performance
Review service activity by staff member during the selected period.
Activity over time
See how request volume changes across the selected dates or reporting interval.
Service performance
Compare average response and average completion time across the selected periods.
Dashboard and analytics questions
Answers to common questions about dashboard visibility, filters, staff activity, request status, and historical service trends.
Managers can review request totals and status, operational indicators, request counts, staff activity, overall activity trends, and average response and completion time.
Yes. The available controls can focus the view by configured location, area, service item, staff member, date range, time range, and reporting interval.
Yes. The dashboard can present activity using reporting intervals such as hour, day, week, or month, depending on the selected view.
It shows service activity associated with individual staff members during the selected period. It should be interpreted together with request type, location, workload, and operating context.
The dashboard provides a current operational overview and allows managers to select historical date and time ranges for comparison and trend review.